“People may spend their whole lives climbing the ladder of success only to find, once they reach the top, that the ladder is leaning against the wrong wall.” ~Thomas Merton
Today’s labor market is very different than it was 20+ years ago when many of your parents and teachers were making decisions about their career. Please share these infographics with your students, parents, teachers and greater community so that students can make informed decisions regarding their future.
Industry Specific Infographics
Somali Version of Industry Infographics
Spanish Versions of Industry Infographics
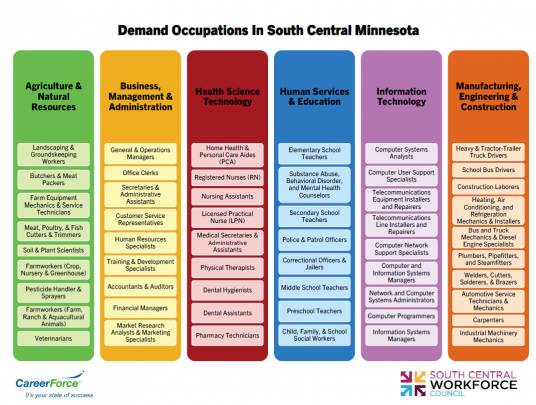
Demand Occupations for South Central MN – 2025
Source: DEED, Labor Market Information (updated September 2024)
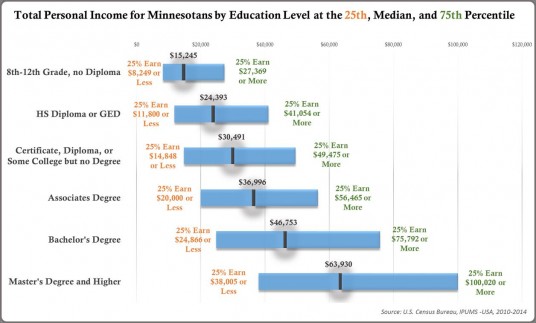
Graphic 1: Annual Wages by Education Level PDF
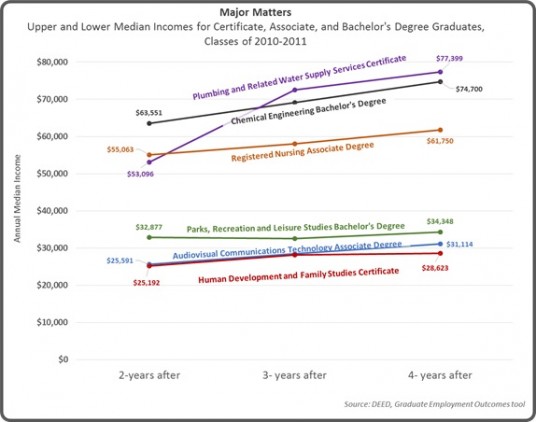
The type of position as well as the degree are vital factors in determining future wages. Each degree offers a range of wages that differ by industry. For example, students who graduated from a Minnesota college in 2010/2011 with an Associate Degree in the Construction Trades is making a median full-time wage of $50,831 compared to a graduate with a Bachelor Degree in Liberal Arts and Sciences; General Studies and Humanities who is making $38,930 (Source: DEED Graduate Employment Outcomes).
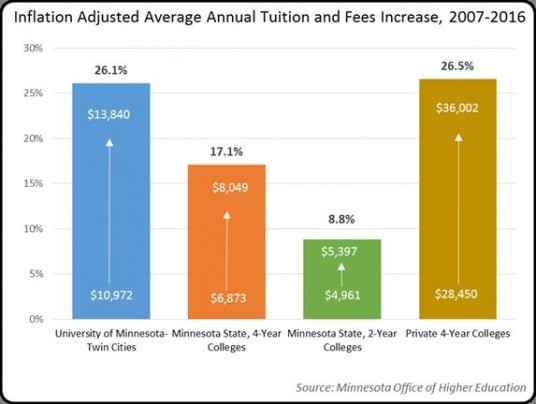
Graphic 2: Average Annual Tuition Increase PDF
When deciding on a career, consider the cost of education as it compares to projected earnings. Higher education often brings significant benefits, such as increased earnings and job opportunities, along with newly minted skills and knowledge. However, the price for this expanded horizon has become increasingly more costly. Learn more by clicking HERE.
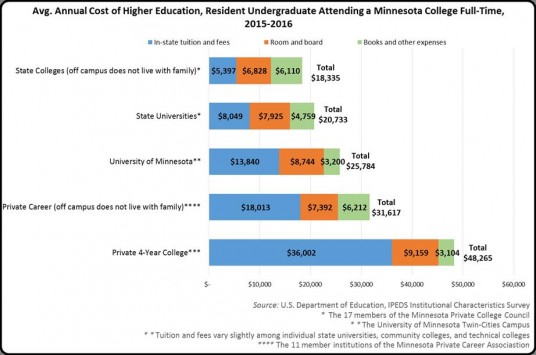
Graphic 3: Cost of a Degree PDF
An Associate’s degree at a state college will cost roughly $36,670 ($18,335 x 2 years) and a Bachelor’s degree with four years attending a state university will cost roughly $82,932 ($20,733 x 4 years). These rough estimates do not factor in annual changes in tuition or other expenses. Click HERE to read the article “What to Know Before You Owe.”
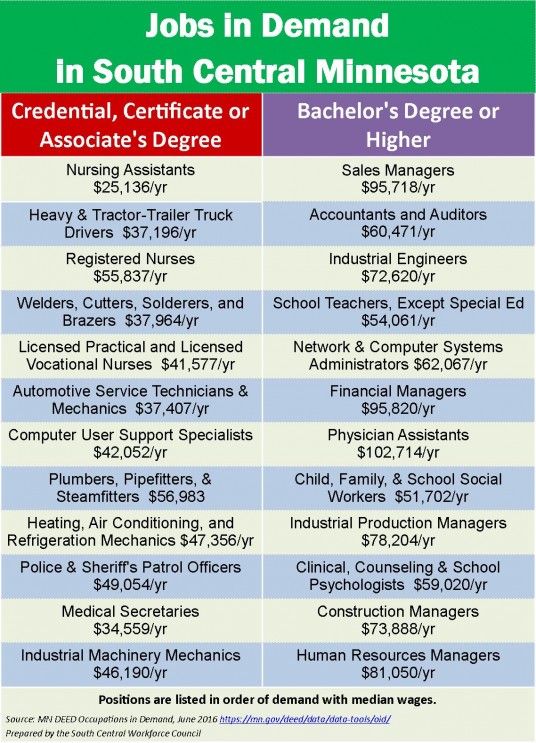
Graphic 4: Jobs in Demand in Your Region PDF
Here are the current jobs in demand in your region of Minnesota by education level. They are listed in order of demand and include median wages.
Educational Needs of the Workforce
https://mn.gov/deed/newscenter/publications/trends/december-2016/educational-needs.jsp
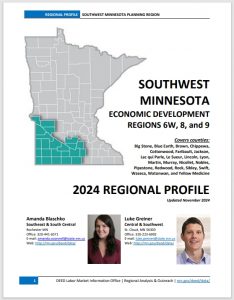
Southwest Minnesota Regional Profile – 2024
